You have just delivered an incredible report on a time consuming and data intensive project. Weeks of analysis and hard work have been dedicated to answering key project objectives in a concise way. However, there is still a plethora of data that stakeholders want to get their hands on – introducing dashboards.
Dashboard ready research
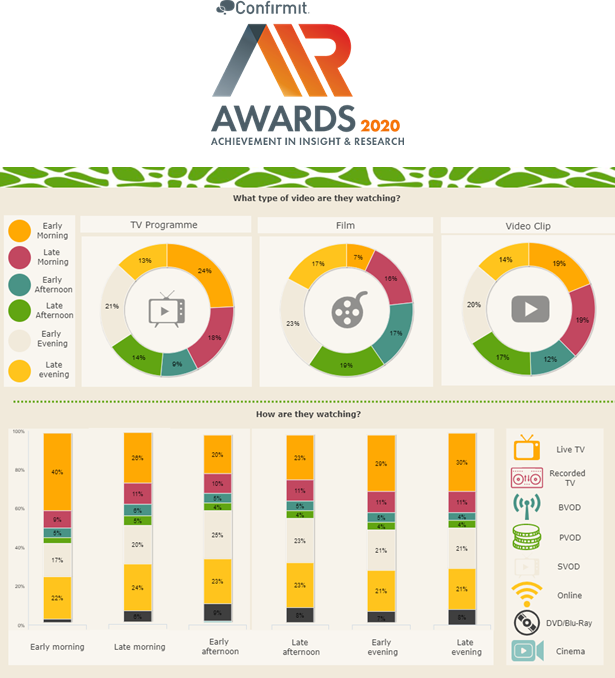
We have been running the ‘Kids and The Screen’ study for 3 years, developing one consolidated data source to provide the complete picture of video consumption for kids aged 2-12. Unique in its approach, KATS is an online diary study, recording viewing occasions in the moment. It has over 90,000 viewing occasions recorded to date and therefore a vast amount of data points that can be cross-referenced and many waves to be compared.
To effectively and efficiently manage the breadth of data this study brings we created our own, award-winning dashboard. It enables the management of multiple stakeholders needs in a time effective and visually appealing way. Not only does the dashboard allow for easy dissemination of insights, but stakeholders are able to manipulate the data themselves through a user-friendly platform, with visuals that bring the data to life and drive long-term engagement.
Five key considerations for dashboard design and implementation
- Identify the right project – Not all projects lend themselves to the dashboard deliverable. Projects which are run across multiple waves, have multiple stakeholders and are data heavy should instantly be considered. Dashboards can gather multiple sources of data and can handle a vast array of data points that can be consolidated into a single interface.
- Build a dashboard deliverable into the scope at the start – It is important to know from the outset that the data will be feeding into a dashboard so that research tools can be framed with this in mind, and data collection is conducive to dashboard specifications.
- Interactivity and visualisation are key – Creating a visually striking but also intuitive dashboard is essential for maintaining the narrative of the research that a report would provide. Dashboards allow you to have fun with the data, having an engaging well-designed dashboard encourages stakeholders to interact with the data and share more readily across the business – maximum exposure for all!
- Collaborate on dashboard design – Data is a company’s most important advantage. Therefore, being able to access the data, in a way that works for them as a business will ensure longer term engagement.
- Dashboards do not need to be used in isolation – Dashboards are by no means an alternative option to reports. They can work well as complimentary to shorter ‘summary’ reports that provide the core narrative of the research. The dashboard is able to provide a platform for deeper interrogation of data and adjustable audience filters.
The world is moving online, and this is no different for data and insight. Dashboards are a valuable addition to the researcher’s toolkit and on the right project can enhance the way insights are shared.
To find out more about our award winning Kids and The Screen dashboard, please get in touch with us at [email protected].
Leave a comment